
Phase Transition of Eigenvalues of Covariances from the Spiked Mixture Model in High-dimensional Regimes
Published in Preprint, 2026
The spiked mixture model (SMM) has been introduced as a probabilistic model that generalizes the single-spike (Wishart) model to a mixture model form. With applications ranging from imaging mass spectrometry in the life sciences to hyperspectral imaging in computer vision, it is crucial to understand under which circumstances its signals can be recovered from noisy measurements.
In this paper, we prove that the extreme eigenvalues of the covariance matrix from the SMM exhibit a phase transition in high-dimensional regimes. We show that this phase transition, and thus signal recovery by extreme eigenvalues, depends on several interacting factors:
- the correlation between spikes (i.e., how similar in content underlying signals are)
- the energy parameters (i.e., the absolute strength of each underlying signal),
- and the mixture probabilities (i.e., how likely it is to encounter each underlying signal).
This work provides sharp information-theoretic bounds on the parameters needed to detect one or more spikes from extreme eigenvalues of the SMM covariance matrix, and these guarantees could potentially impact any application of the SMM.
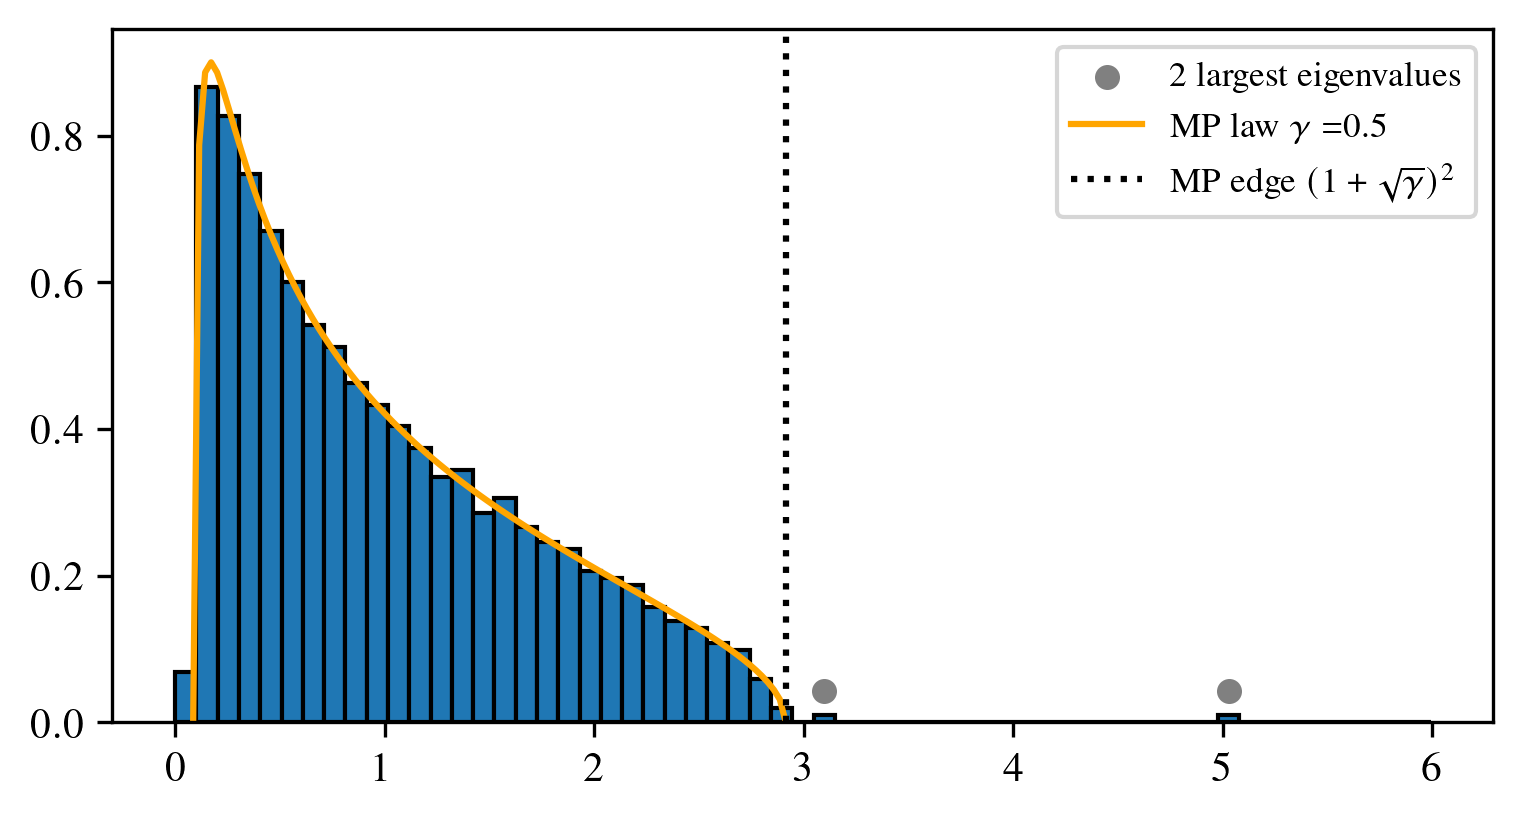 (a) Example of two eigenvalues escaping the bulk of the Marˇchenko–Pastur (MP) distribution. In this example dataset with \(n = 2000\), \(d = 1000\), \(K = \), and \(\gamma = 0.5\), the spike signal strengths were set to \( \beta_1 = 4\) and \(\beta_2 = 5\), the spike probabilities to \(\pi_1 = 0.4\) and \( \pi_2 = 0.6\), and the spike correlation to \(\theta\). This plot shows both the theoretical (orange line) and the empirical (blue bars) Marchenko–Pastur distributions. For these particular hyperparameter values, we observe two eigenvalues (gray circles) successfully popping out of the bulk of the Marchenko–Pastur distribution, reporting detectability. | |
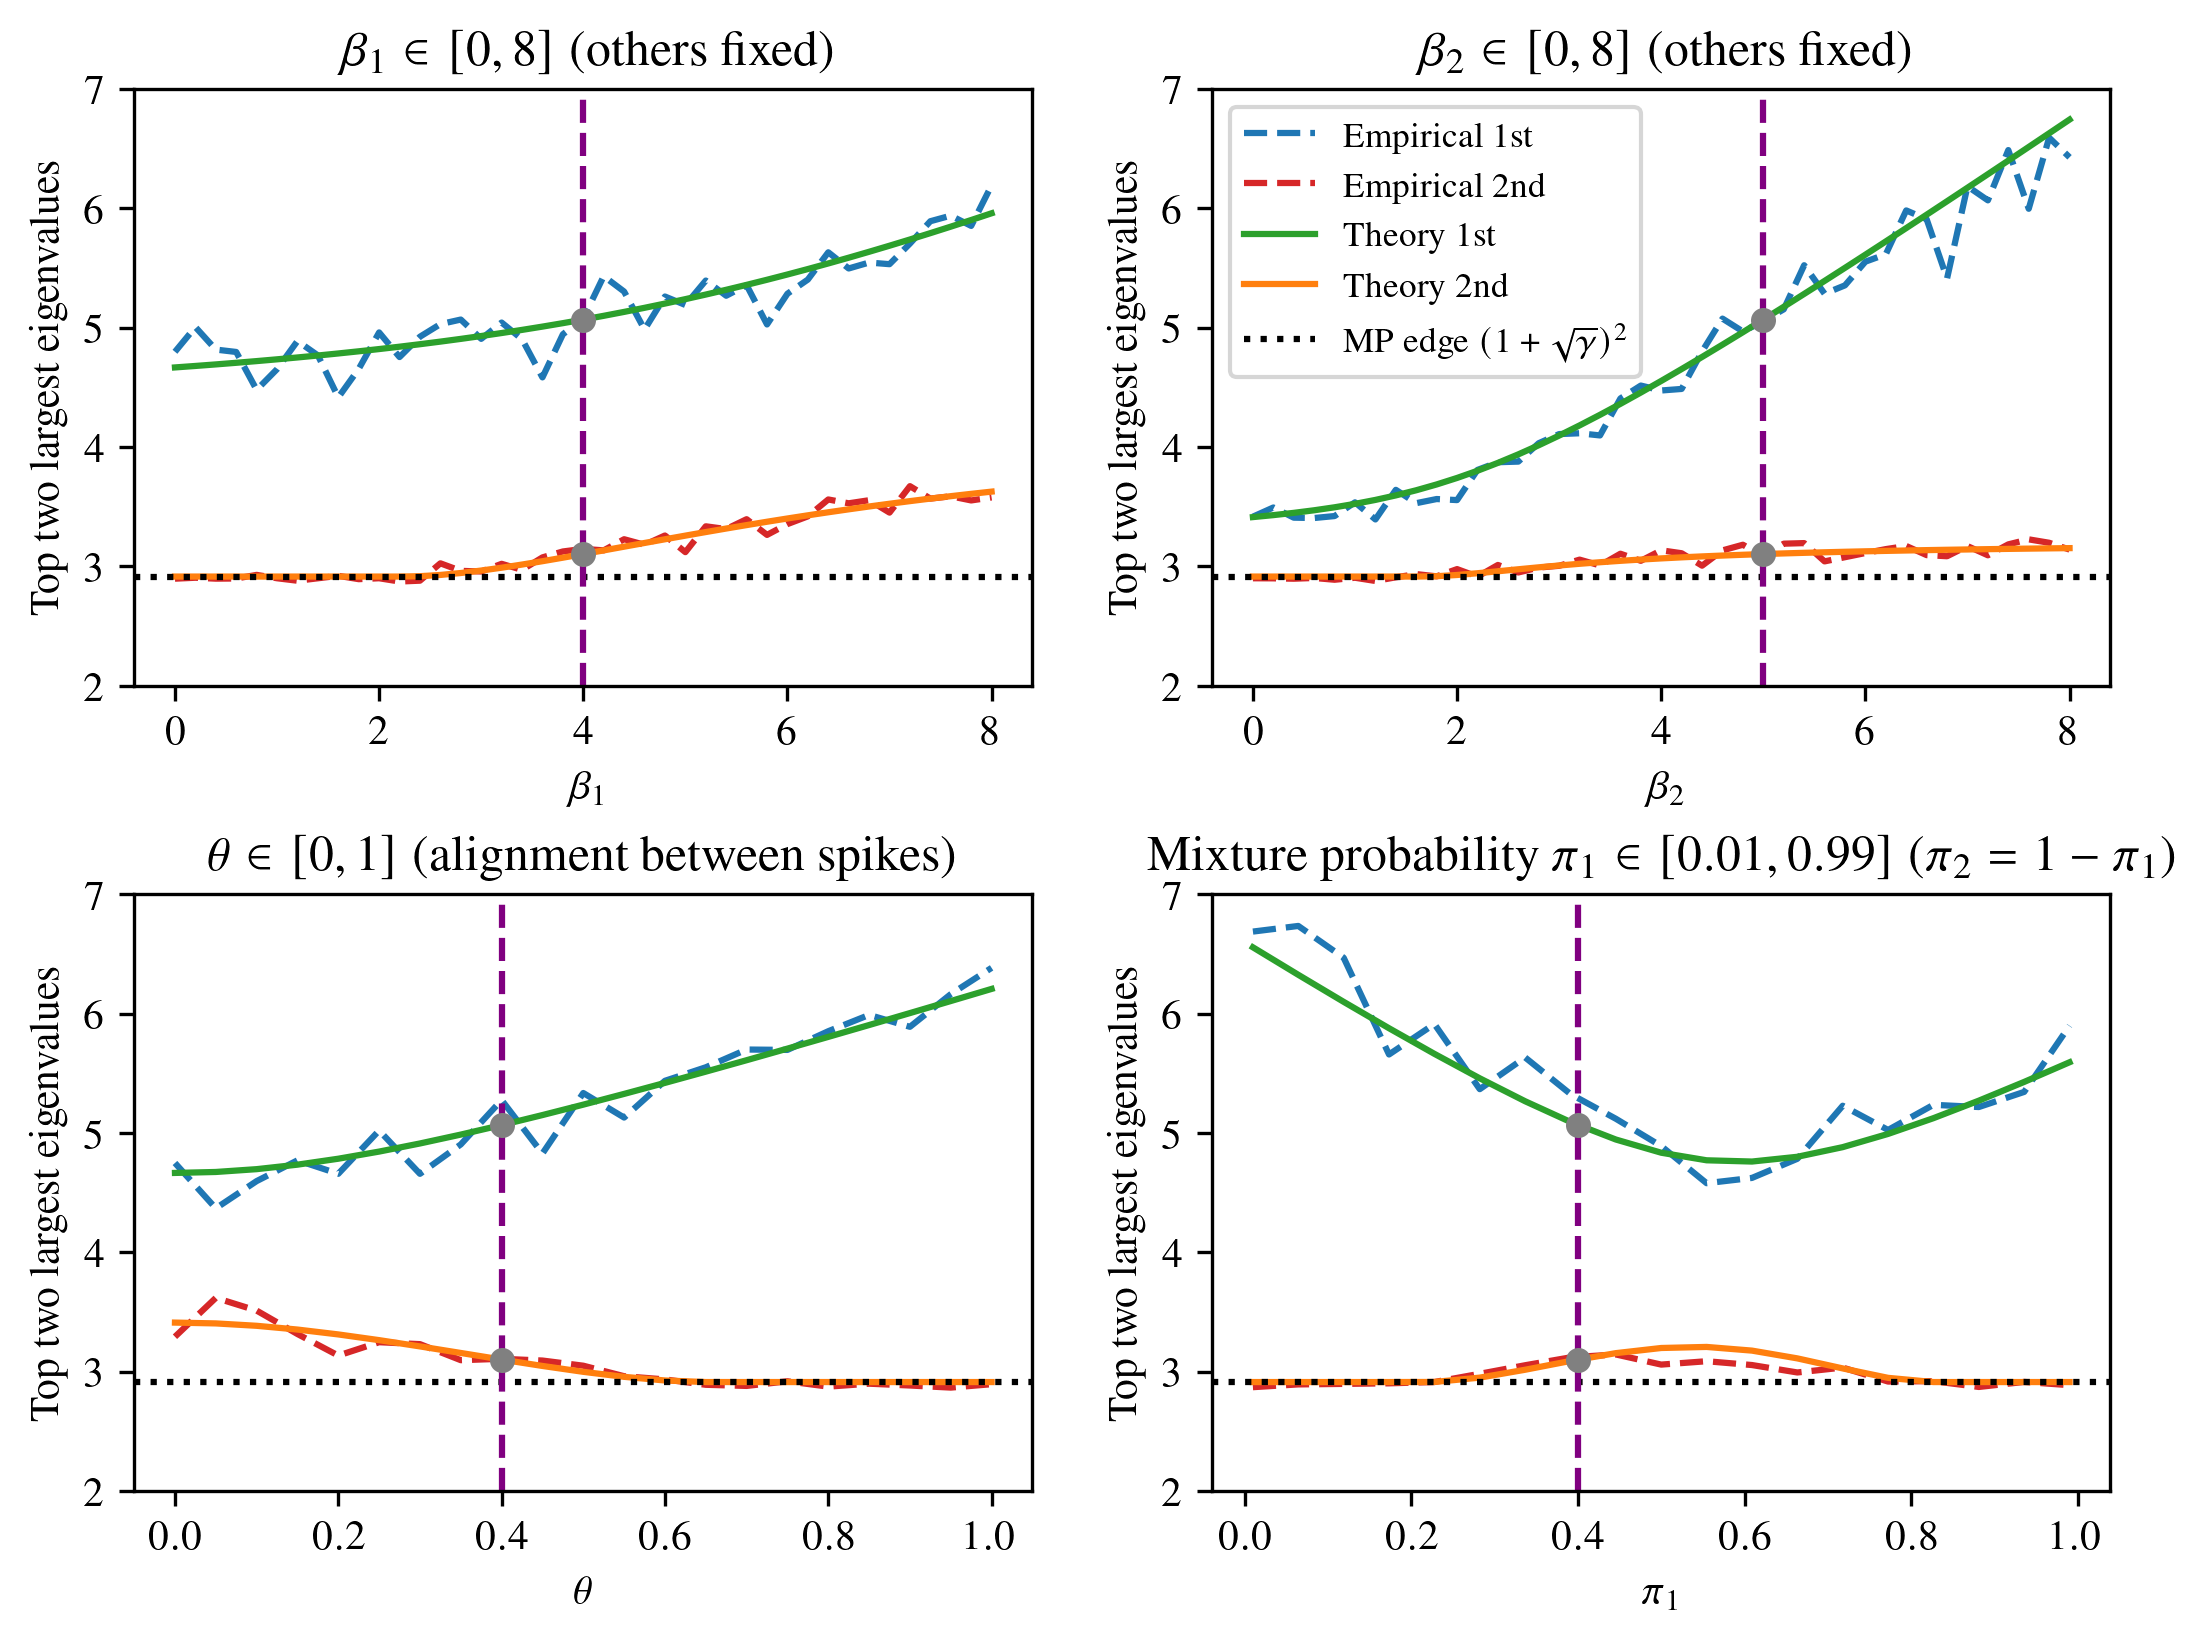 (b) Effect of changing one of the hyperparameters. We show how varying a single hyperparameter, while keeping all others the same as in panel (a) impact the two largest eigenvalues. We explore varying the signal strength of the first spike, \(\beta_1\) (top-left), the signal strength of the second spike, \(\beta_2\) (top-right), the correlation between the spikes, \(\theta\) (bottom-left), and the spike probabilities, \(\pi_1\) and \(\pi_2\) (bottom-right). |